The Postmillennial
REVELATION
Timeline
A visualization of the whole book of Revelation. A (partial-preterist) side-by-side chart of its prophecies and their first-century fulfillments, from Jesus' birth to the Bar Kokhba Revolt (4 BC-AD 136). A map of Revelation's structure and main themes. An untangling of its trickiest chronological controversies.
The culmination of all Dr. Phil Kayser's Revelation studies, condensed into one 30"x40" chart that makes Revelation make sense.
What People Are Saying
"...a one-stop chart that clearly explain[s] the entire structure of [Revelation], all the key passages, and the historical notes and facts to back it all up... From the Hebraic chiastic structure of the book to its clear historic fulfillment in 70 A.D., Dr. Phillip Kayser has provided the Church with a fantastic resource. Sunday Schools, homeschools, Christian schools, families, and pastors would do well to get one of these laminated and kept somewhere handy."
Toby Sumpter
Pastor at Christ Church, Moscow, ID and Host of CrossPolitic.
"...informative, illuminating, and inspiring. Dr. Kayser has provided us with an incredibly helpful teaching tool that should find its way into every church and Sunday School. Highly recommended."
Dr. George Grant
Parish Presbyterian Church, Franklin, TN
"[Dr. Phil Kayser's] work on the book of Revelation has earned my highest endorsement. ...the partial preterist approach to understanding Revelation has never been more clearly or convincingly put forward. ... I am pleased to see the capstone come forth in such a glorious way."
Martin Selbrede
Chalcedon Foundation
"No-brainer if you're seeking to raise Biblically literate children who feel hope for the future. I am beyond thankful to have a colorful, irresistible piece hanging on our wall that will whisper to my children's hearts throughout their childhood, 'Come, rest. Every nightmare is coming untrue.'"
Shelby Shepherd
Co-founder Evergreen Planner, homeschool mom of 3
"I am grateful for Dr. Phil Kayser’s work on this illustrative chart bringing the details contained in John's Apocalypse and the progression of Christ’s Kingdom to light. ...the chart presents for us in living color our Lord Jesus Christ’s inevitable and perpetual pattern of victories over all enemies in this age and in the final consummation."
Kevin Swanson
Generations
How This Chart Works
Includes:
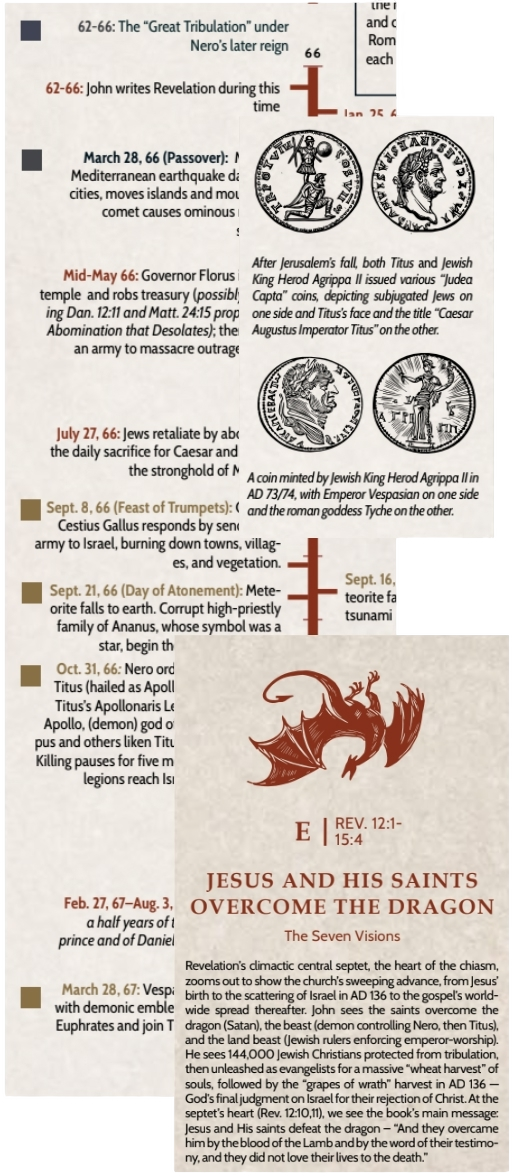
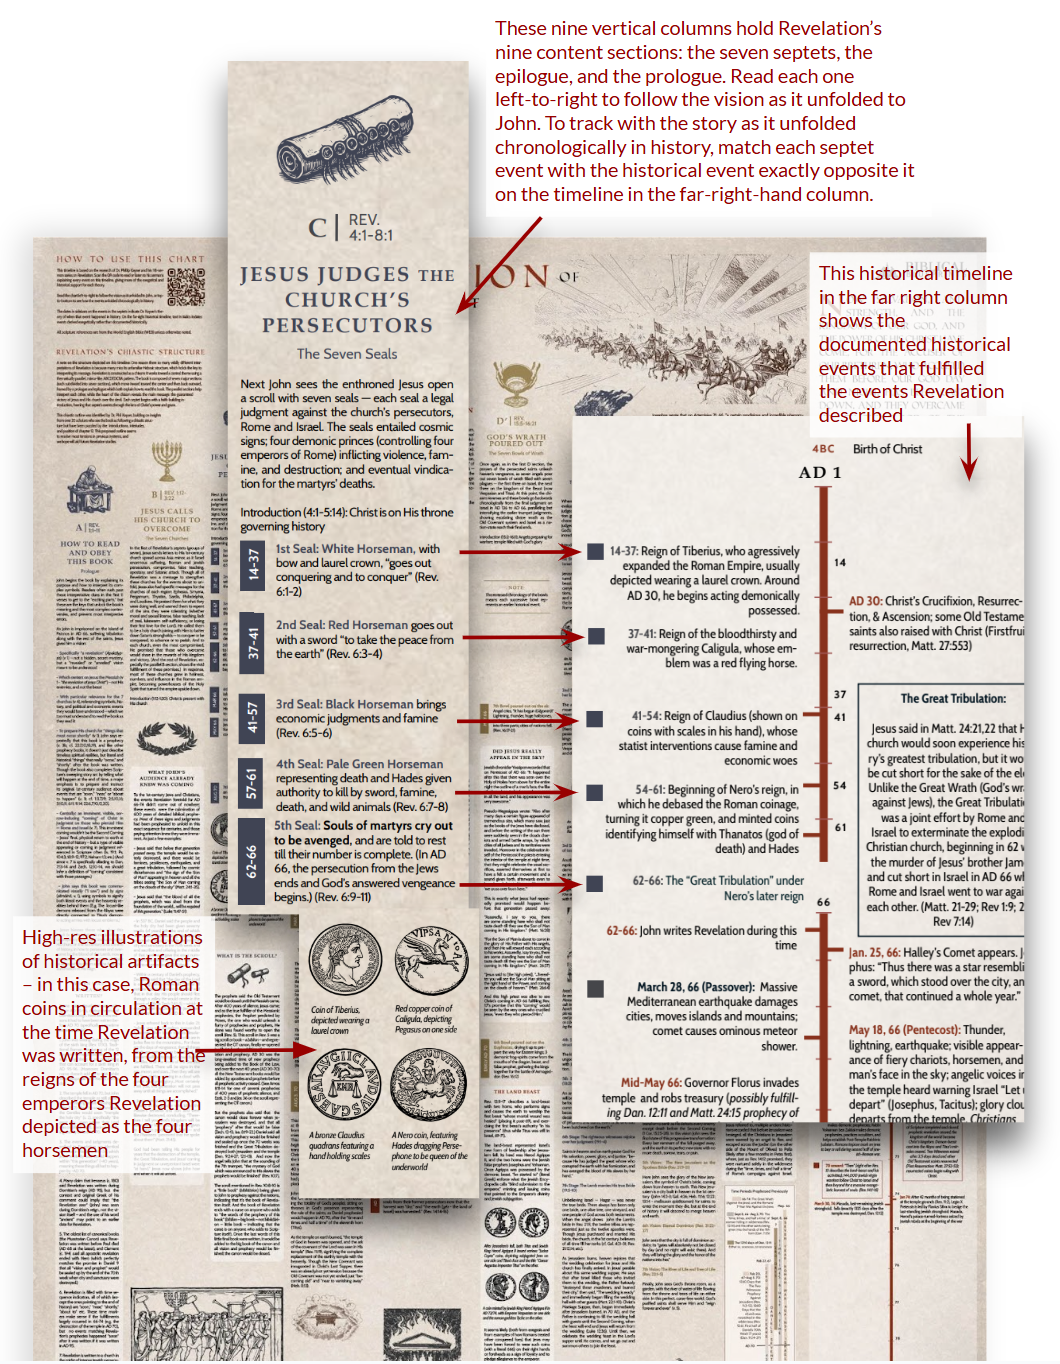
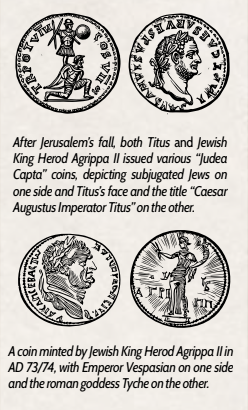
Illustrations of historical artifacts confirming the exegesis
Quotes from eyewitnesses and ancient Jewish and Roman chroniclers
Explanations of:
- The closing of the canon in AD 70
- The dating of Revelation's writing to AD 66
- The chronology of Daniel's 70 weeks
- The identity of the scroll, the two witnesses, the harlot, and the two beasts, the four horsemen, and much more
- Zechariah 14 and the 1st century Christians' flight to Pella
An overview of the interpretive keys John provides in chapter one to guide the interpretation of the rest of the book
Clear, exegetical delineations between what was fulfilled in the 1st century and what will happen at the end of history

BETTER THAN A BOOK FOR:
- Visualizing Revelation's chiastic structure, to help you grasp the flow of the entire book at once
- Showing Revelation's prophecies and their historically-documented fulfillments side-by-side, to help you wrap your head around the entire progression of the book, from Jesus' birth in 4 BC, to the scattering of Israel in 136 AD in the Bar Kokhba Revolt.
- Getting a quick (but surprisingly deep) overview of Revelation's story arc, themes, history, and still-to-come promises (in about 130 hours less than it takes to listen to Dr. Kayser's Revelation sermon series)
- Daily visual reminders of Jesus' victory over the dragon and false religious and political saviors, and the other powerful themes of Revelation
- Introducing your children to Revelation's story and main lessons
WHAT MAKES THIS TIMELINE SPECIAL
BUILT ON INTERNAL EVIDENCES
Rather than starting with history, Dr. Kayser uses internal evidences — Revelation's chiastic structure, the interpretive keys in the first chapter, and cross-dating between all the events prophesied in Zechariah, Daniel, Matthew, Luke, and Isaiah — to pinpoint the timing of events such as the destruction of the temple, the beginning and end of the Roman-Jewish war, the Great Tribulation, the actions of the sea beast and land beast, the visible appearing of Christ in the sky — and then discovered historical documentation of all these things
INFORMED BY THE BOOK'S CHIASTIC STRUCTURE
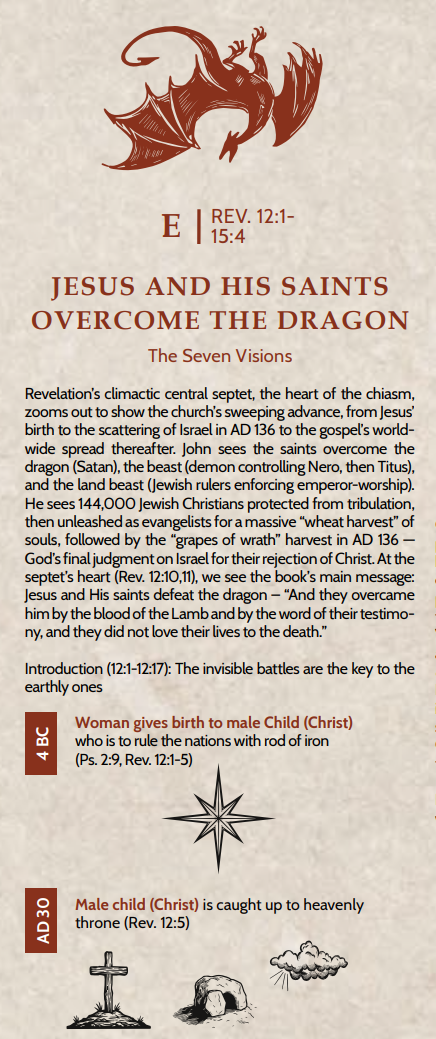
One reason Revelation mystifies so many is because of its unfamiliar Hebrew structure. It's constructed as a chiasm (a mirror-like ABCDEFGFEDCBA pattern that works inward to a core theme and then back outward), meaning the book's parallel sections help interpret each other, while the heart of the chiasm reveals the main message. Understanding the structure unlocks everything, and being able to visually see the structure while reading the themes of Revelation and the historical events fulfilled makes it all click together.
REINFORCED WITH DEEP HISTORICAL RESEARCH
Dr. Kayser's deep digging into 1st-century archeology, seismology, and astronomy turned up historical records of precise fulfillments of Revelation's prophesies —
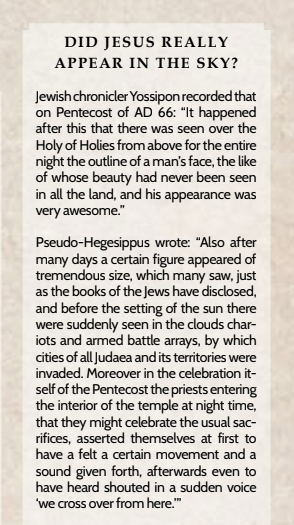
...For instance, discovering that multiple ancient historians actually recorded a visible appearing of Jesus in the sky in AD 66, blood running up to the horse's bridles during the Bar Kokhba Revolt in AD 135, and an earthquake in AD 66 that really did move mountains and islands.
WHO WE MADE THIS TIMELINE FOR:
- Pastors teaching through Revelation
- Parents trying to raise biblically-literate, courageous kids who understand Christ's ongoing victory and the role they play in His work of "making all things new"
- Anyone wanting to "hear and obey" the words of this book
- Serious students wanting to master Revelation's structure, exegesis, and history
- Dads and moms who want to guide their families through the powerful messages of Revelation in family worship
- Homeschool moms or Christian school teachers teaching unit studies on ancient history, biblical prophecy, biblical history, or Bible literacy
- Sunday school teachers, Bible study leaders
About the Author

Dr. Phillip Kayser has read over a hundred Revelation commentaries and preached a 118-sermon series on Revelation. He's a pastor, author, and counselor with a focus on detailed biblical scholarship and the international church. He's passionate about seeing Scripture's comprehensive blueprints applied to business, art, education, science, economics, marketing, health, counseling, and every other area of life.
Phil Kayser personally studied under Greg Bahnsen, Gordon Clark, John Frame, and Jay Adams, and has an M.Div from Westminster Theological Seminary and a Ph.D. from Whitefield Theological Seminary. He serves on the board of The Bahnsen Project, as Professor of Ethics at Whitefield Theological Seminary, and on the board of the Pickering Foundation of Biblical Preservation (an evangelical think-tank preserving the text of Scripture).
Phil was raised in Ethiopia, the son of missionary parents who spent 30 years in the field with SIM International, and saw the Word of God transform every area of Ethiopian pagan culture. Ever since, he's had a passion for seeing the transformational gospel and God's biblical blueprints for life taken to the ends of the earth. For years he travelled to restricted countries to coach church planters, mentor students, and teach theology. He has helped plant five churches and currently serves as Senior Pastor of Dominion Covenant Church in Omaha, Nebraska, focusing his preaching on careful exegesis and practical application. He and his wife Kathy have five children and many grandchildren.
Phil has some big projects in the works, including a current sermon series on Deuteronomy, a book on Biblical Civics, and most importantly, his Great Axioms Project, which explores the Biblical axioms of math, geometry, logic, and of 40+ other disciplines in order to root our educational curriculum more radically in the Scriptures than has ever been done before.